| View previous topic :: View next topic |
| Author |
Message |
windfind
Joined: 18 Mar 1997
Posts: 1901
|
 Posted: Wed Jun 17, 2020 10:07 am Post subject: Great video for understanding wind models Posted: Wed Jun 17, 2020 10:07 am Post subject: Great video for understanding wind models |
 |
|
Hi Gang,
If you have ever wondered about all the different models and resolution and when to use each model you need to see this very professional video.
Ten top wind forecast models: https://www.youtube.com/watch?v=lDNK3iKMu9k
Your IW or IK or Sailflow membership gives you all of the models discussed that cover North America.
Mike Godsey
weatherflow.com
windalert.com
iwindsurf.com
ikitesurf.com
sailflow.com
fishweather.com
USAfishing.com
https://windnotes.smugmug.com
| Description: |
|
| Filesize: |
99.07 KB |
| Viewed: |
20913 Time(s) |
|
|
|
| Back to top |
|
 |
mac
Joined: 07 Mar 1999
Posts: 17747
Location: Berkeley, California
|
| Posted: Wed Jun 17, 2020 10:30 am Post subject: |
|
|
| So Mike--in my over 40 years of windsurfing on the bay, this has been one of the gustiest years. It also seems to have been one of the hardest to predict. I've run into multiple bubbles, where the wind has dropped 4 to 6 mph after 3:00, leaving us bobbing around on too small sails. Several days in the past ten, it has been blowing dogs off chains--but with huge gusts and shifts. Yesterday was predicted to be the windiest day--and then the wind dropped to about 4. What is going on?
|
|
| Back to top |
|
|
windsrf
Joined: 01 May 1998
Posts: 464
|
| Posted: Wed Jun 17, 2020 12:14 pm Post subject: |
|
|
Mike,
I found the video link she refers to during first minute of this presentation to be much more interesting - "why is US reading different, etc...".
Question it raised for me relates to time-averaging vs. instantaneous readings for sensor graphics. That takes me back to my strong preference for displays showing some avg (as for Berkeley sensor) rather than the "noisy" ones like the TI sensor.
Your thoughts?
Thanks, David
|
|
| Back to top |
|
|
tcevans
Joined: 16 Jul 2002
Posts: 78
|
| Posted: Wed Jun 17, 2020 1:10 pm Post subject: |
|
|
Mike,
Thanks for posting - very interesting!
Two questions about the weather models:
1) Do any of the models use a "big data" approach, i.e. make predictions purely based on past observations, vs. a fundamental "wind physics" approach?
2) Which model(s) are used on the iWindsurf App for the free "Blend (Quicklook)" and the "Blend (Quicklook Plus) (Premium)"
Thanks,
Tom
|
|
| Back to top |
|
|
windfind
Joined: 18 Mar 1997
Posts: 1901
|
| Posted: Wed Jun 17, 2020 3:31 pm Post subject: |
|
|
| tcevans wrote: | Mike,
Thanks for posting - very interesting!
Two questions about the weather models:
1) Do any of the models use a "big data" approach, i.e. make predictions purely based on past observations, vs. a fundamental "wind physics" approach?
2) Which model(s) are used on the iWindsurf App for the free "Blend (Quicklook)" and the "Blend (Quicklook Plus) (Premium)"
Thanks,
Tom |
Hi tcevans,
I will take your question firsts since answering it is easy since I can pass it onto our ModelOps crew at the Weatherflow Denver office. Below is their Slack discussion regarding your question.
(I would add that using "Big Data" and AI will just save forecasters some time in working up a forecast. There is still a lot of things like the eddy and marine layer distribution that AI can not handle. One good thing will be that when the forecasters screw up the 300 manual human table entries at least the model data will be more useful)
Mike Godsey
iwindsurf.com/ikitesurf.com
Weatheflow.com
| Description: |
|
| Filesize: |
173.45 KB |
| Viewed: |
20839 Time(s) |

|
|
|
| Back to top |
|
|
windfind
Joined: 18 Mar 1997
Posts: 1901
|
| Posted: Wed Jun 17, 2020 7:31 pm Post subject: |
|
|
| mac wrote: | | So Mike--in my over 40 years of windsurfing on the bay, this has been one of the gustiest years. It also seems to have been one of the hardest to predict. I've run into multiple bubbles, where the wind has dropped 4 to 6 mph after 3:00, leaving us bobbing around on too small sails. Several days in the past ten, it has been blowing dogs off chains--but with huge gusts and shifts. Yesterday was predicted to be the windiest day--and then the wind dropped to about 4. What is going on? |
Hi Mac,
The long answer to your question would take a very long blog. Here is the very short answer.
The images below show some of the issues.
1. We are moving into a La Nina pattern. (correcting earlier typo)
2. That makes the N. and S. excursions of the upper trough and upper ridges more pronounced.
3. That in turn has meant more days with the winds just over the Bay Area more W. than NW during clearing wind days.
4. That means those W. winds are hitting the coast range at 90 degrees rather than at an angle that funnels the wind through gaps in the coast range. So less reliable wind.
4. Hitting the coast range at 90 degrees means more turbulence and winds waves over the Bay and these wind waves cause more gusts and lulls.
5. We have had many days with a thermal low pressure over the Bay in the AM. + NNE winds aloft and NNW surface winds west of the ocean buoys. For quailty winds we need constant NW surface wind to create our normal coastal upwwelling that keeps our our coast waters really cold.
6. Less upwelling means less frequent and more shallow marine layer clouds to keep our winds steady. Notice how infrequent June Gloom has been this year?
Have you noticed that a very large % of my forecasts have the words UP AND DOWN and FADE in them? That is due to the above. All of this has made this a very difficult forecast season.
Incidentally, the Gorge and Southern California area also suffering.
Look for a blog to visit this topic in detail.
Mike Godsey
| Description: |
|
| Filesize: |
187.33 KB |
| Viewed: |
20804 Time(s) |

|
Last edited by windfind on Wed Jun 24, 2020 9:04 am; edited 1 time in total |
|
| Back to top |
|
|
ctuna
Joined: 27 Jun 1995
Posts: 1125
Location: Santa Cruz Ca
|
| Posted: Mon Jun 22, 2020 11:36 pm Post subject: |
|
|
Does the Hi Res 1km coverage extend to the Bay Area?
Is it worth looking at if it does?
Is there a link to it .
|
|
| Back to top |
|
|
windfind
Joined: 18 Mar 1997
Posts: 1901
|
| Posted: Tue Jun 23, 2020 9:47 am Post subject: |
|
|
Hi ctuna,
Yep we cover the Bay Area. Our proprietary WF-WRF covers the Bay Area from Bodega to Sherman Island to just past Waddell.
Go to this link:
https://wx.iwindsurf.com/map#37.829,-122.539,10,399839
Then on left margin click on More Maps
Then click on Forecast Map
Then click on Customize
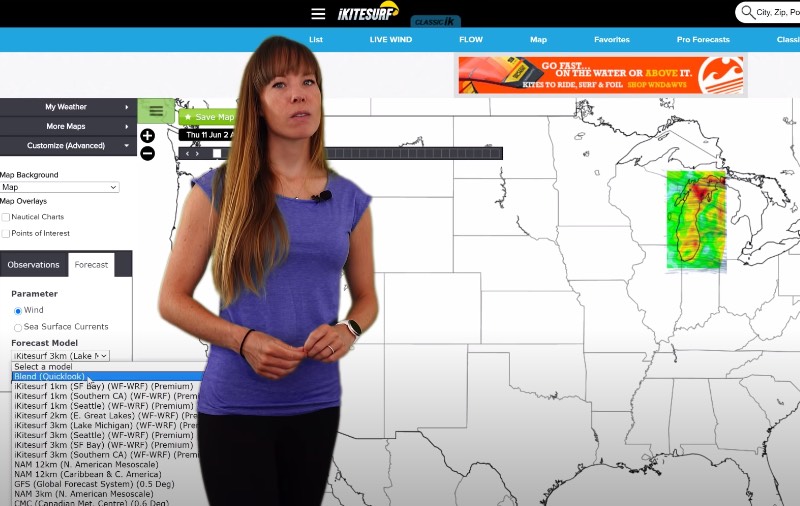
Then at the bottom of the Customize box Click and hold on Forecast Model.
Select iwindsurf 1km WF-WRF
To best use the model next click on Map Background and select Terrain
Then adjust Overlay Opacity until you can see the coast range gaps AND the model data.
Unless you are in a rush avoid using the 1km tables you see in phone apps.
Models work by breaking and area into grids, in this case, 1 km., for which they forecast. The model tables just give you the wind forecast for the grid box that covers your launch site. The model map gives you the wind forecast for the sailing waters and the nearby wind that may impact your site. And by looking at the nearby hills and gaps you can see if what the model is forecasting is plausible.
Always remember that the model is run every 6 hours and the marine layer positioning can change in minutes. The human forecast considers the likely movement of the fog and features like eddies that the models often miss.
We also offer the hourly 3 km HRRR model from the same link. This is the model that the video says in #1. Unfortunately, this model does poorly in the Bay Area due to our complex topography.
Lastly, don't ask why we bury the 1km model so deeply in the interface.
Mike Godsey
iwindsurf.com/ikitesurf.com
Weatheflow.com
| Description: |
|
| Filesize: |
190.77 KB |
| Viewed: |
20640 Time(s) |

|
|
|
| Back to top |
|
|
ctuna
Joined: 27 Jun 1995
Posts: 1125
Location: Santa Cruz Ca
|
| Posted: Tue Jun 23, 2020 11:34 am Post subject: |
|
|
Looks like the 1k map only covers a square over the bay area.
Doesn't stretch down to Santa Cruz , San Luis or Sherman.
Looks like Sherman and San Luis where about to Nuke last night
and dropped to nothing this morning.
|
|
| Back to top |
|
|
windfind
Joined: 18 Mar 1997
Posts: 1901
|
| Posted: Tue Jun 23, 2020 3:45 pm Post subject: |
|
|
Hi ctuna,
The entire area covered by the 1km WF-WRF in the first image below. If you don't see Sherman Island at first zoom out. Drag and zoom in to see the model forecast for the area near your site.
To see San Luis and sites south of Waddell and a much larger area go through the steps I gave above but instead select the 3 km WF-WRF. It is a lower res. so it does not "see topograph" well so it is less accurate.
If you cruise around the web you will notice that Weatherflow is almost the only company that offers 1 km resolution. Such high res. requires a huge amount of computer power. The only reason we can do it is that we only cover a very tiny portion of the USA at 1km and because we use the Amazon cloud for computation rather than a supercomputer and we only update the model every 6 hours.
For fun the rest of the images show the other models and how they compare to our WF-WRF in resolving the gaps in the coast range that funnel our winds to launch sites.
Notice how our 1 km WF-WRF does a pretty good job of forecasting the funneling of winds.
But the 3km HRRR only resolves the Golden Gate and barely can tell that there is a San Bruno Gap and totally misses the other gaps.
While the 29 km GSF worldwide model does not even see the Golden Gate. Since this is a free model this is the wind forecast you see on most apps.
Mike Godsey
| Description: |
|
| Filesize: |
184.1 KB |
| Viewed: |
20595 Time(s) |

|
| Description: |
|
| Filesize: |
470.83 KB |
| Viewed: |
20595 Time(s) |

|
|
|
| Back to top |
|
|
|
|
You cannot post new topics in this forum
You cannot reply to topics in this forum
You cannot edit your posts in this forum
You cannot delete your posts in this forum
You cannot vote in polls in this forum
You can attach files in this forum
You can download files in this forum
|
|
|

