myiW Current Conditions and Forecasts Community Forums Buy and Sell Services
 
Hi guest · myAccount · Log in
 SearchSearch   ProfileProfile   Log in to check your private messagesLog in to check your private messages   RegisterRegister 
Anybody know where the Gorge forecaster gets their flow data

 
Post new topic   Reply to topic    iWindsurf Community Forum Index -> Northwest USA & Canada
View previous topic :: View next topic  
Author Message
johnl


Joined: 05 Jun 1994
Posts: 1330
Location: Hood River OR

PostPosted: Sun Jun 15, 2014 1:43 pm    Post subject: Anybody know where the Gorge forecaster gets their flow data Reply with quote

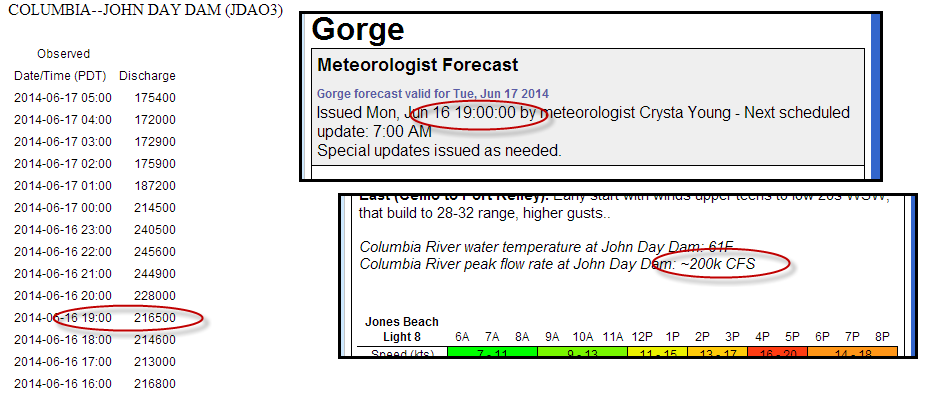
I've been watching the Gorge forecast a lot lately (like most of you) and I'm baffled by the forecast. Specifically the John Day flow. Today (6/15/14) forecast said "Columbia River Peak Flow rate at John Day Dam ~260 cfs".

First of all I think it is awesome that they add this since it helps determine if I'm going to drive to Maryhill or Rufus. But unfortunately this conflicts with my sources.

http://www.nwrfc.noaa.gov/river/station/flowplot/flowplot.cgi?JDAO3

This shows the INFLOW (ie water coming INTO the dam) as approximately 240k cfs which would somewhat match the forecast. BUT the DISCHARGE (ie water going out of the dam and heading to Rufus, the Wall, and Maryhill) was 201k cfs @0800 PDT which is quite a difference.

Anybody else have any input on this? Such as maybe I'm using the wrong source (I doubt) or reading it wrong (I really hope not)?
Back to top
View user's profile Send private message
gmclean


Joined: 08 Mar 2001
Posts: 91

PostPosted: Sun Jun 15, 2014 1:54 pm    Post subject: Reply with quote

I think discharge is what is important but this probably requires more research in the field Very Happy
Back to top
View user's profile Send private message
mcterry65


Joined: 12 Sep 2000
Posts: 12

PostPosted: Sun Jun 15, 2014 2:18 pm    Post subject: Reply with quote

http://www.nwd-wc.usace.army.mil/ftppub/project_data/hourly/jda_0daysback.txt
Back to top
View user's profile Send private message
30knotwind


Joined: 30 Aug 2005
Posts: 239
Location: White Salmon, WA

PostPosted: Mon Jun 16, 2014 3:17 pm    Post subject: Reply with quote

I have a forecast page:
http://www.30knotwind.com/p/river-discharge-forecasts.html

John Day data:
http://www.nwd-wc.usace.army.mil/report/jda.htm

Actual data at The Dalles:
Chart

Table


river forecast.png
 Description:
 Filesize:  222.9 KB
 Viewed:  17004 Time(s)

river forecast.png


_________________
~~~~~~~~~~~~~~~~~~~~~
http://www.30knotwind.com/
Back to top
View user's profile Send private message Visit poster's website
johnl


Joined: 05 Jun 1994
Posts: 1330
Location: Hood River OR

PostPosted: Mon Jun 16, 2014 9:21 pm    Post subject: Reply with quote

Thanks 30knowt, but your flows are high also. They are showing 240ish for today when the reality is the flows (by my NOAA source and MCTerry) are closer to the 200k cfs range. Yours seems to share the same flow rate as the Gorge Forecaster, HOWEVER I did notice that the forecast flow dropped significantly in the current forecast. Maybe the forecaster noticed they were reading the inflow and not the discharge? Smile
Back to top
View user's profile Send private message
Temira


Joined: 15 Jun 1999
Posts: 94
Location: Hood River

PostPosted: Mon Jun 16, 2014 9:40 pm    Post subject: Reply with quote

Hi all. Temira here. I get mine from these links:

John Day
http://www.nwd-wc.usace.army.mil/ftppub/project_data/hourly/jda_0daysback.txt

The Dalles
http://waterdata.usgs.gov/or/nwis/current/?type=flow

I don't know if they're spot-on, but they do change from day to day, and do seem to reflect the changes I see in the river.

FYI, flow on SuperTuesday was around 363kcfs.

How about all this wind?

=)
Back to top
View user's profile Send private message Visit poster's website
johnl


Joined: 05 Jun 1994
Posts: 1330
Location: Hood River OR

PostPosted: Mon Jun 16, 2014 11:04 pm    Post subject: Reply with quote

From what I've seen they can change quite a bit during the day also Smile But I was comparing the data I was seeing @0800 vs the forecast (probably 0600 or so). That should be fairly close Smile But it wasn't Sad
Back to top
View user's profile Send private message
30knotwind


Joined: 30 Aug 2005
Posts: 239
Location: White Salmon, WA

PostPosted: Tue Jun 17, 2014 7:44 am    Post subject: Reply with quote

Johnl, your page shows similar observations to the forecast, although I was assuming the forecaster was publishing the observed data since the temperature data is an observation.
http://www.nwrfc.noaa.gov/station/flowplot/textPlot.cgi?id=JDAO3&pe=QR

Note that this morning it is already below 200 KCFS
-Chris


John Day CFS.png
 Description:
 Filesize:  56.82 KB
 Viewed:  16932 Time(s)

John Day CFS.png


_________________
~~~~~~~~~~~~~~~~~~~~~
http://www.30knotwind.com/
Back to top
View user's profile Send private message Visit poster's website
johnl


Joined: 05 Jun 1994
Posts: 1330
Location: Hood River OR

PostPosted: Wed Jun 18, 2014 12:00 am    Post subject: Reply with quote

Thanks Crysta you gave me a good laugh reading the forecast. Nice to see you are lurking in the forums... Wink
Back to top
View user's profile Send private message
Display posts from previous:   
Post new topic   Reply to topic    iWindsurf Community Forum Index -> Northwest USA & Canada All times are GMT - 5 Hours
Page 1 of 1

 
Jump to:  
You cannot post new topics in this forum
You cannot reply to topics in this forum
You cannot edit your posts in this forum
You cannot delete your posts in this forum
You cannot vote in polls in this forum
You can attach files in this forum
You can download files in this forum

myiW | Weather | Community | Membership | Support | Log in
like us on facebook
© Copyright 1999-2007 WeatherFlow, Inc Contact Us Ad Marketplace

Powered by phpBB © 2001, 2005 phpBB Group